
Business reporting
POS reporting that tells you what to do next
Short sales reports arrive on your schedule, each finding comes with a suggested action, and Esplanda records what that action earned.
Reports are part of the free Esplanda POS. The monthly P&L, expense coding and the cash forecast are Books & Expenses, $99 a month per location. See Esplanda pricing.
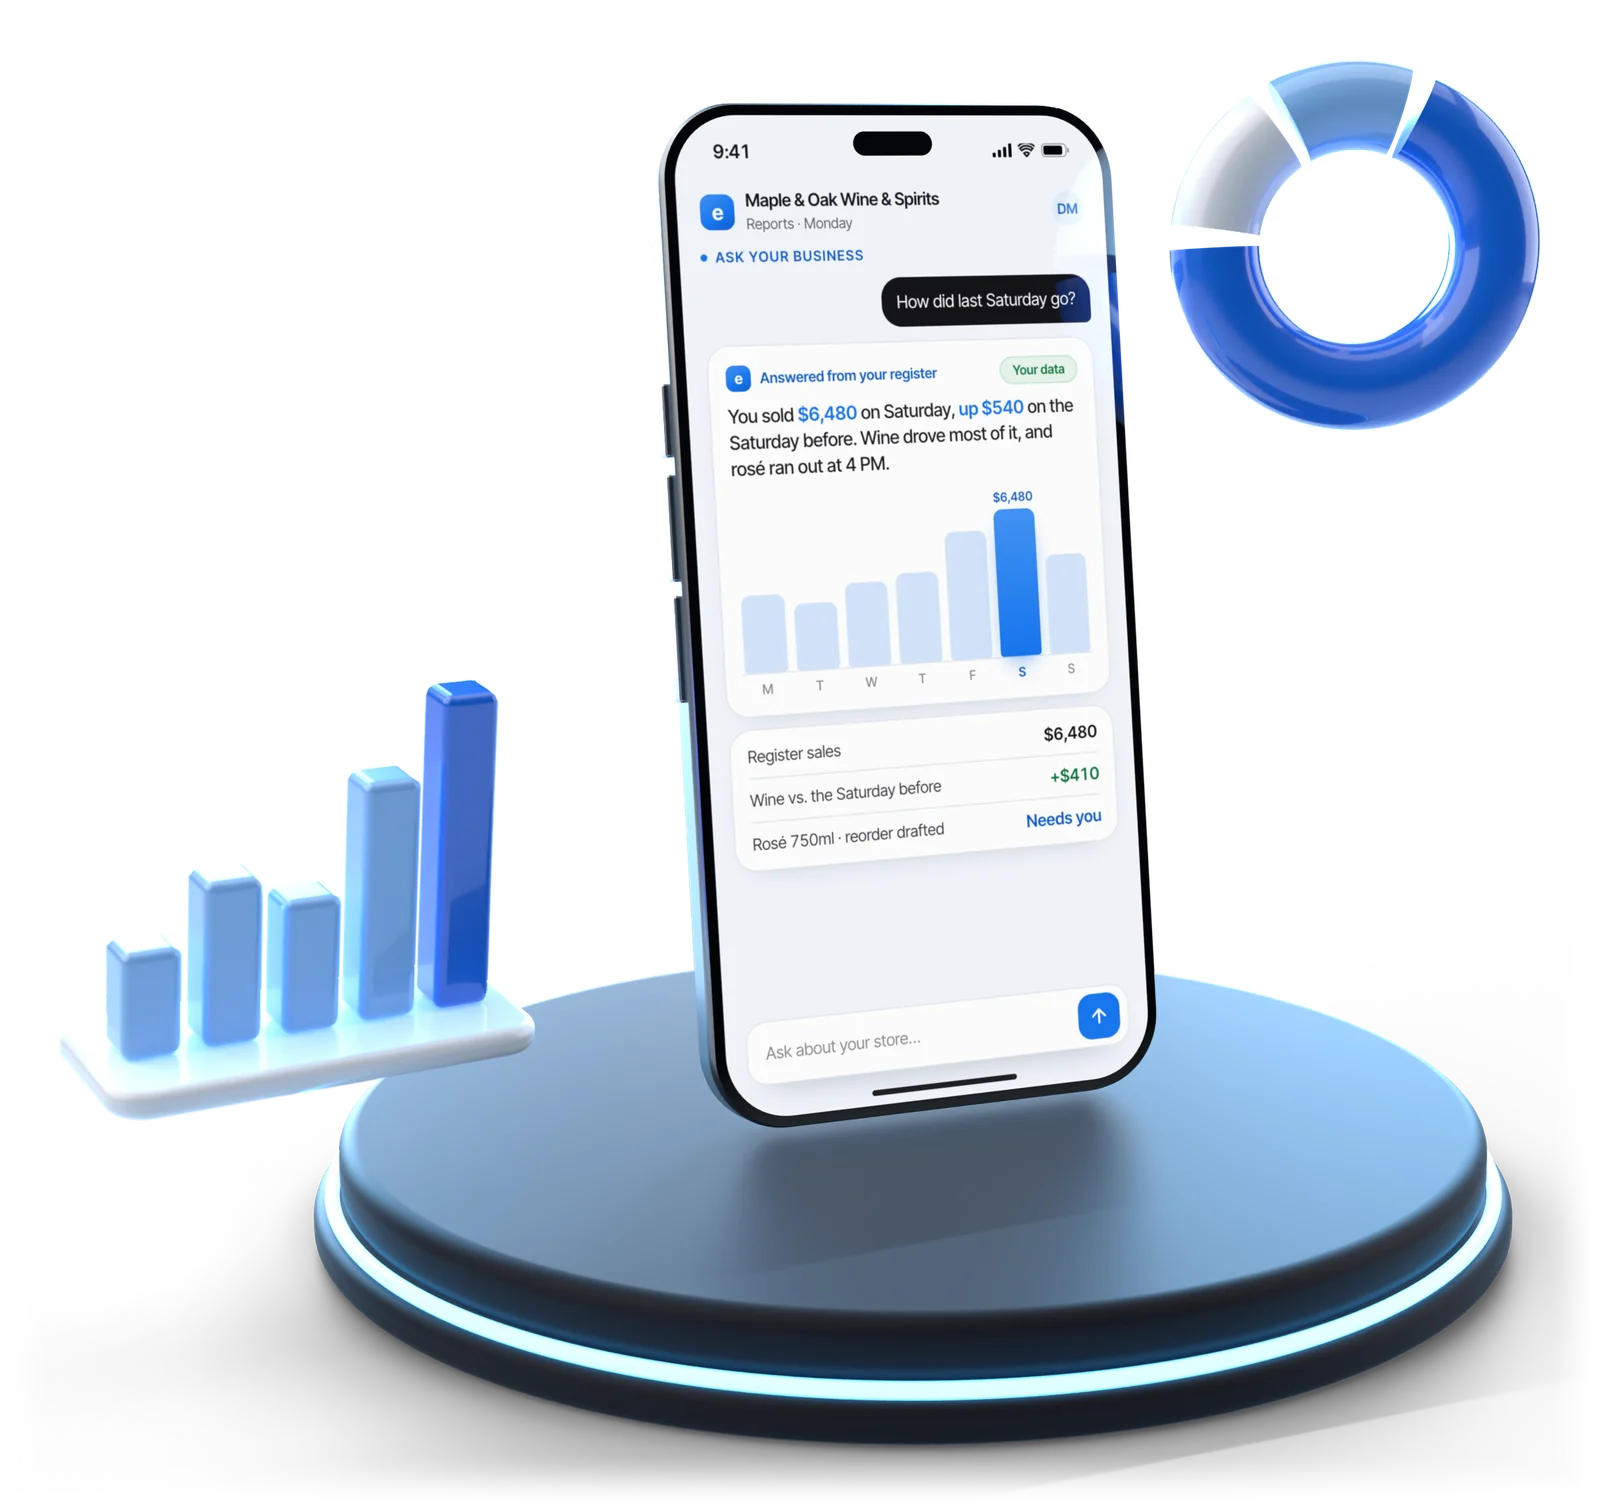
Illustrative example
The reports
The POS reports worth reading
Most owners need a handful of reports, not fifty. Everything else is a drill-down you open when one of these moves.
| Report | The question it answers | When it arrives |
|---|---|---|
| Daily sales | Was yesterday normal for a Tuesday? Yesterday against the same day last week. | Every morning, by text or email |
| End-of-day close | Did every payment add up, and did the drawer balance? Your Z report, on Esplanda POS. | Every close |
| Hour by hour | When am I busy, and am I staffed for it? | Weekly, with the schedule beside it |
| Margin by category | Which departments carry the margin, not just the revenue? | Weekly and monthly |
| Basket size | Are people buying fewer things, or cheaper things? | Weekly |
| Top and bottom sellers | What earns its shelf space, and what should stop being reordered? Ranked by margin. | Monthly |
| Staff and stores | Who sells more per hour worked, and which store is off the group's pattern? | Monthly; stores weekly |
| Monthly P&L | What did the month actually make, and which line moved? | Monthly, with Books & Expenses |
Basket size, defined. Average basket size is total sales divided by the number of transactions. It moves on its own, so a flat customer count with a falling basket is a mix problem, not a quiet month.
The bottom of the list. Slow sellers are usually dead stock, and our inventory management for small business is where they stop being reordered. What to stop carrying, and where its buyers go instead, is in our assortment planning software. Every report exports to CSV.
Z report, defined. A Z report is the end-of-day total a register produces when it closes the day: sales, refunds, discounts, tax and each payment type. On Esplanda POS the drawer is counted blind first, then shows expected against counted, over or short, by cashier and shift.
How often to read them. Sales and the close daily; hours, margin and basket size weekly; sellers, staff and the P&L monthly.
Reports that act
From POS analytics to a measured result
A chart that changes nothing is a cost. Most small business analytics software stops at the chart. Esplanda takes the next four steps.
It finds the number
Say wine margin slips against the last four weeks.
It finds the cause
Three supplier costs rose and two shelf prices didn't follow.
It proposes the fix
A price change, checked against nearby prices with our competitor price tracking, with the dollars it should earn.
You approve it
In one tap, or edit it, or say no. Or let Esplanda act inside limits you set once.
It records the result
Measured over a window fixed in advance, next to the prediction. See how we measure results.
Esplanda can tell you what to do, prepare the fix for your one-tap OK, or make it inside limits you set once. That setting is yours.
Profit and loss
A monthly P&L that closes itself
A profit and loss statement shows what the month made: net sales, minus the cost of the goods you sold, minus the cost of being open. As profit and loss software, Esplanda builds the statement through the month and tells you which line moved. The P&L comes with Books & Expenses, the line that also codes your bills and receipts.
Clean numbers for your bookkeeper: profit, costs and the sales tax you're holding, in plain dollars.
Every statement exports as CSV and a categorized general-ledger summary, ready for your bookkeeper or accountant.
Keep the register you have, or use ours. POS reporting is cleanest on our POS system with inventory management, which is free, where cost of goods is a calculation, not an estimate. Square, Clover, Lightspeed and KORONA connect too.
How the month closesNo close day
Revenue. Net sales, with discounts, refunds, voids and sales tax split out, not buried in one total.
Cost of goods. From the supplier invoices you actually received, not the cost keyed in on setup day. A cost that went up is flagged with what it adds in a year at your volume. Our invoice scanning software, free in Esplanda POS, reads the invoices from a photo.
Expenses sorted. Bills and supplier payments sorted on their own; anything unclear waits for a short review instead of a guess.
Labor. Hours worked, overtime included, from our employee scheduling software.
Card fees. Read from your processor's statement, with the effective rate. Esplanda processes card payments as a reseller for First American Payment Systems, a Deluxe company; compare any rate against your own statement, with every input beside the result, on credit card processing for small business.
Which line moved. Every line against the last three months and the same month last year, as a dollar change, with a short note on why.
What the month madeReady for your bookkeeper
Cash and what pays
Cash, not just profit
Cash and profit move on different clocks, which is why a good month can feel bad and a bad month can feel fine. Esplanda keeps both in view, looks ahead, and checks what each idea and each channel really earns.
A cash forecast that warns early
With Books & Expenses, Esplanda forecasts cash for the weeks ahead and warns before a cash crunch, while there’s still time to do something about it.
Every idea checked against real profit
Before you commit to a promotion or a new line, it checks the idea against your real costs and shows where it breaks even.
What each channel really earned
Sales by channel after what each one costs, from delivery-app commission to ad spend, so keeping or dropping a channel is decided on a number.
Walk-in sale+$10.84
The same order through a delivery app−$3.69
Illustrative example
Profit by channel, and what each delivery app earns after commission, are part of your free reports. Each action taken on a finding is measured the same way as everything else; see how we measure results.
Staff and locations
Staff and stores, compared fairly
Total sales mostly tells you who worked Saturday. Esplanda compares people and stores on measures they actually control.
People
Sales per hour worked
Plus average basket, items per basket, and voids and discounts by employee. Use it to find who's good at the upsell, not to build a leaderboard nobody trusts.
Stores
Sales per trading hour
Stores compared with margin, basket size and labor as a share of sales, never raw revenue, which the store open longest always wins. Esplanda flags the single line where one store is off the group's pattern. More on multi-location inventory management.
What-if scenarios
Ask what would happen before you spend
What happens if I raise prices 3%? Esplanda answers before you do it: a likely range, the factors driving it and the outside events to watch, so you decide with the whole picture in front of you.
- What if I add a person?
- What if I stay open an extra hour?
- What if I carry less wine?
- What if I add delivery?
- The range. A likely outcome for sales, gross profit, operating profit, units, labor cost and cash, each with a band around it.
- The drivers. The factors doing the work, ranked by how much of the spread each one accounts for.
- What to watch. The outside events that could move the result: a competitor's reaction, a new store opening, a supply problem, weather past the forecast window. Listed on every answer.
- The history check. A clear flag and a wider band when you ask about something new to your store, like a far bigger price move than any before it.
- The hand-off. One button turns the scenario into a costed plan for your approval. A scenario more than a week old is run again first, because the business has moved.
Built from what Esplanda already runs for your store: price sensitivity measured on your own past price changes, what your customers buy instead when something costs more, your item costs, your labor, and the same demand forecasting software that drives reordering. Nearby published prices and anonymized benchmarks from comparable stores are labeled as outside inputs that show the pattern around you; see retail benchmarking.
Questions
Reporting and P&L questions owners ask
What is POS reporting?
POS reporting turns the sales your register records into regular reports: sales by day and by hour, margin by category, basket size, top and bottom sellers, and staff and stores. Esplanda's business reporting software sends a short set on your schedule, adds a monthly profit and loss with Books & Expenses, and proposes what to do about each finding.
What POS reports should a small business owner look at?
Five, most weeks: yesterday's sales against the same day last week, sales by hour, category mix by margin, average basket size, and the top and bottom sellers. Everything else is a drill-down you open when one of those moves. An owner reading twenty reports is reading none of them.
How can POS data help cut labor costs?
Put sales by hour next to the schedule. Quiet hours with several people on the floor show where to trim, and busy hours with too few show where sales walk out. Esplanda sends that report weekly with the schedule beside it, and compares sales per hour worked and labor as a share of sales across staff and stores.
What is a profit and loss statement?
A profit and loss statement is a summary of what a business earned and spent over a period, usually a month, ending in the profit or loss left over. It starts with net sales, subtracts the cost of the goods you sold, then subtracts operating costs such as rent, labor, utilities and card fees.
Why is my bank balance higher than my profit?
Cash and profit move on different clocks. Unpaid supplier invoices make the balance look healthy, stock you bought is cash gone that only becomes a cost when it sells, and sales tax you're holding belongs to the state. Esplanda shows both views and names why they differ this month.
Can I get a daily sales report by text or email?
Yes. Esplanda sends a short daily summary at a time you choose, by text or email, to you and anyone you add, such as a manager or your bookkeeper. It shows yesterday against the same day last week, anything unusual, and what Esplanda proposes to do about it.
How does Esplanda work with my bookkeeper?
With Books & Expenses, Esplanda gives you an operating profit and loss during the month, while you can still act on it, and hands your bookkeeper clean numbers at month end. The statement, the expense detail and the transactions export as CSV and as a categorized general-ledger summary your bookkeeper or accountant can use.
Do the reports work if I keep Square or Clover?
Yes. Keep the register you have, or use ours. Esplanda connects to Square, Clover, Lightspeed and KORONA with no change at the counter. Reports are cleanest on Esplanda POS, which is free, because the sale, the discount and the item cost come from the same records with nothing to reconcile at night.
How much does Esplanda reporting cost?
Reports are part of the free Esplanda POS, with no setup fee and no contract. The monthly profit and loss, expense coding and the cash forecast are Books & Expenses, at $99 a month per location, which hands your bookkeeper or accountant clean books every month. Esplanda prepares the books, and the tax filing stays with your accountant.
See what last month actually made
Start free today, or book a demo and we'll walk through the reports and the P&L on a store like yours.
Esplanda POS and your website are free to start, with no card needed. Add paid tools only when you want them. See Esplanda pricing.